Graph clustering and graph visualization
Introduction
The java programs provided on this web page implement a graph clustering and visualization method described in the following papers:
- Représentation d'un grand réseau à partir d'une classification hiérarchique de ses sommets. Fabrice Rossi and Nathalie Villa-Vialaneix. Journal de la Société Française de Statistique, volume 152, number 3, pages 34-65, December 2011;
- Visual Mining of Epidemic Networks. Stéphan Clémençon, Hector De Arazoza, Fabrice Rossi and Viet-Chi Tran. In Advances in Computational Intelligence (Proceedings of the International Work Conference on Artificial Neural Networks, IWANN 2011), edited by Joan Cabestany, Ignacio Rojas and Gonzalo Joya, volume 6692, pages 276-283, Torremolinos (Spain), June 2011.
- Analyse exploratoire d'un graphe : le cas de la contamination par le VIH à Cuba. Fabrice Rossi, Stéphan Clémençon, Hector De Arazoza and Viet-Chi Tran. In Congrès SMAI 2011, 5ème Biennale Française des Mathématiques Appliquées, Guidel (France), May 2011
- Hierarchical clustering for graph visualization. Stéphan Clémençon, Hector De Arazoza, Fabrice Rossi and Viet-Chi Tran. In Proceedings of XVIIIth European Symposium on Artificial Neural Networks (ESANN 2011), pages 227-232, Bruges (Belgium), April 2011
The method is based on two main components implement by two different standalone programs: a graph clustering program and a graph layout calculation program. They operate on a basic file format for graphs and handle only undirected (but possibly weighted) graphs. A graph is given by the list of its edges. Each line of the file contains one edge described by the identifiers of the two vertices connected and by an optional weight. Those two or three elements must be separated by white spaces or tabulations. Vertex identifiers can be any sequence of symbols without white spaces or tabulations.
Version history
- version-0.7.4 (2012/11/04): bug fix in the random switching generator
- version-0.7.2 (2011/11/11): first public release
Underlying software
My programs are implemented in Java and tested under Linux with Oracle Java
Hotspot 64-Bit Server VM (1.6.x and 1.7.x). The implementation is quite
memory hungry and you might need to allow the JVM to use a large amount of
memory for large graphs. This is done using the non standard options, such as
java -Xmx1G -jar something.jar to allow the JVM to use up to 1GB
of memory.
The programs provided in this page have been implemented using two open source libraries:
- the GNU Trove library
- the args4j library
Jar files are built using the Autojar open source tool.
Citation request
You can use my programs for whatever purpose, but if you do so, I request a citation of the French paper above and a link to the present page. I will gladly list papers that use my code below. If you are interested in the source code, please contact me.
Usage
The clustering method implemented in the program has been used in the following papers:
- Graph-Based Approaches to Clustering Network-Constrained Trajectory Data. Mohamed Khalil El Mahrsi and Fabrice Rossi. In Proceedings of the Workshop on New Frontiers in Mining Complex Patterns (NFMCP 2012), edited by Annalisa Appice, Michelangelo Ceci, Corrado Loglisci, Giuseppe Manco, Elio Masciari and Zbigniew Ras, pages 184-195, Bristol, Royaume-Uni, September 2012 ;
- Clustering par optimisation de la modularité pour trajectoires d'objets mobiles. Mohamed Khalil El Mahrsi and Fabrice Rossi. In Actes des 8èmes journées francophones Mobilité et Ubiquité, edited by Nadine Roose, pages 12-22, Anglet, France, June 2012 ;
- Modularity-Based Clustering for Network-Constrained Trajectories. Mohamed Khalil El Mahrsi and Fabrice Rossi. In Proceedings of the XXth European Symposium on Artificial Neural Networks, Computational Intelligence and Machine Learning (ESANN 2012), pages 471-476, Bruges, Belgique, April 2012.
An example
Dataset
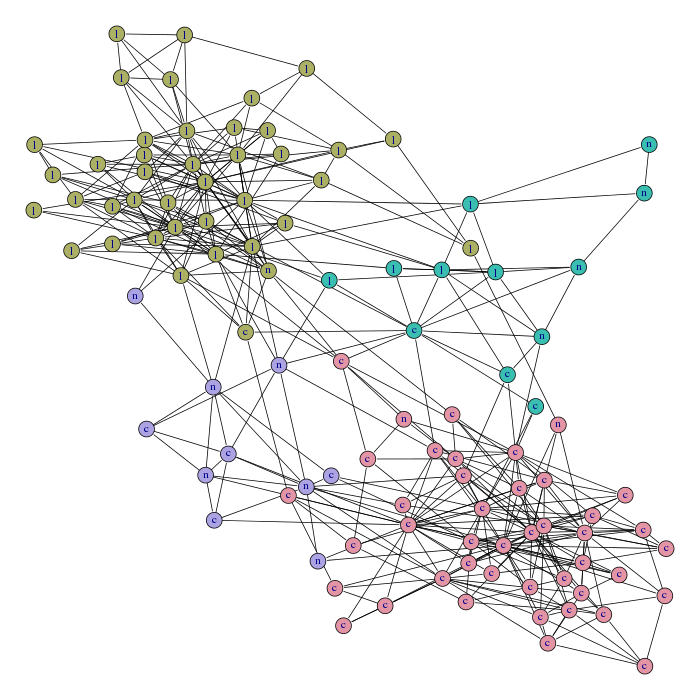
The method is demonstrated on Valdis Krebs' political books dataset, available here.
Reformatted for the tools available here, the graph is described by two files:
- polbooks-edges.txt is the edge file used by the two programs
- polbooks-nodes.txt contains the mapping by ids used in the edge files and various vertex data available in the original data file (here, the original id, the title of the corresponding book and class information)
Clustering
The first step of the method consists in clustering the vertices of the graph. This is done with the following command line (assuming all needed files are in the working directory):
java -jar clustering.jar -graph polbooks-edges.txt -mod polbooks-modularities.txt -part polbooks-clustering.txt -random 100 -recursive
On a Intel Core 2 Duo P8600, this invocation take less than 10 seconds and produces two result files:
- polbooks-clustering.txt contains the full hierarchical partition produced by the algorithm
- polbooks-modularities.txt contains the modularity of the best partition as well as maximal modularities obtained on random graphs with a similar structure as the political books graph
Layout
The second step of the method produces several layouts of the graph using the clustering results. This is done with the following command line:
java -jar hlayout.jar -graph polbooks-edges.txt -part polbooks-clustering.txt -nlayout 100 -outgraph polbooks -layout polbooks -saveall
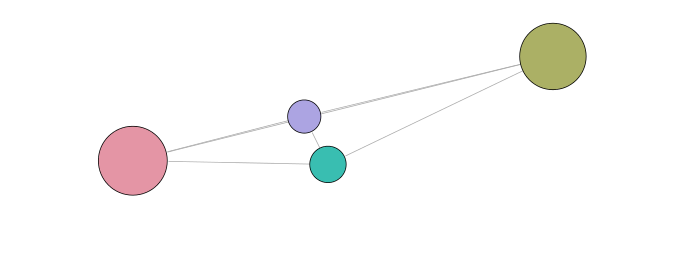
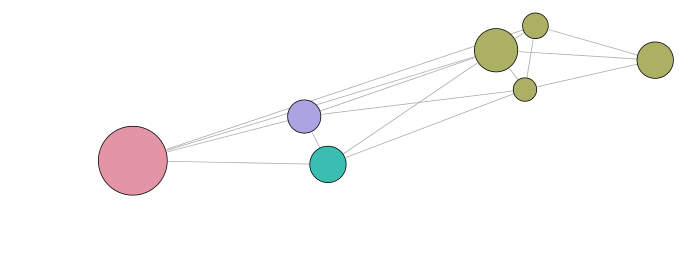
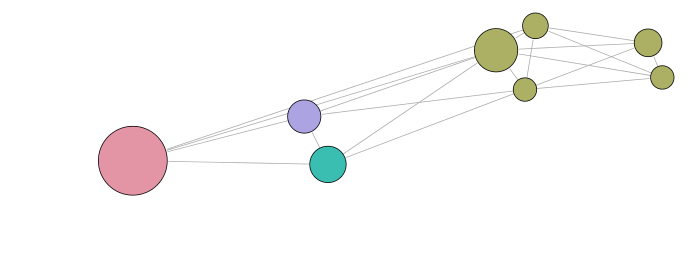
In the particular case of the political books graph, this produces four layouts, from the coarsest partition with four clusters to the finest one with 14 clusters. Results can be downloaded here.
Visualization
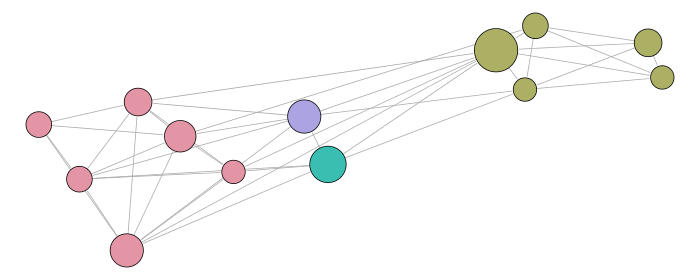
The visual results are given below. The first representation is the graph of the clusters of the best partition (in terms of modularity). Each subsequent representation is obtained by splitting a cluster into sub-clusters, using the same clustering technique. Layouts satisfy the minimum surprise principle as the sub-clusters are drawn at the position previously occupied by their main cluster.
Graph clustering
The method is based on maximal modularity clustering. It implements a variant of the multi-level algorithms studied in Multi-level Algorithms for Modularity Clustering. Andreas Noack and Randolf Rotta. Proceedings of the 8th International Symposium on Experimental Algorithms, pages 257–268, 2009. The main variation is that final clusters are guaranteed to be connected.
In addition to classical graph clustering, the implementation provides two important features:
- clustering significance testing via random graph generation
- hierarchical clustering based on a recursive application of the main algorithm
The output file formats are described in the documentation file.
Graph clustering downloads
Graph layout calculation
The visualization method leverage the hierarchical clustering results of the other program. The main idea consists in representing the graph of the clusters in a way that enables expanding clusters into sub-clusters. The program does not provide a visualization but only a layout (or several layouts) of the graph, that is vertices coordinates. Those coordinates can be used in R, for instance, in order to build an actual visualization.