This page, originally published in late October (2012), gives a summary of my research activity. All the corresponding publications are available on my publication page and directly below.
General Clustering
Most of my work published in 2012 has been dedicated to clustering. I've been working with PhD student Matthieu Durut on Cloud implementation of online versions of the k-means and with my former PhD student Brieuc Conan-Guez on clustering of dissimilarity data. For this last work, we leveraged our former studies on graph clustering to use multilevel refinement tricks in the dissimilarity context. I hope to keep on working on this direction in the following months.
-

An example of multilevel refinement: the two classes top level partition is modified using sub-clusters at different levels in the clustering hierarchy.
Clustering specific data
Trajectories
I've been advising Mohamed Khalil El Mahrsi since early 2011. We work on trajectory clustering with a focus on objects (e.g., cars) moving on a constrained network. We had a series of publications in 2012:
- the first one that set down our idea of using look for maximal modularity clusters of trajectories (followed by a french version that used a better evaluation strategy based on some specific patterns);
- a second one that focused on clusters of road segments where the idea is to complement the trajectory clustering by an analysis of the actual road usage.
We are now working on co-clustering of this type of data.
-

A trajectory data set
Road occupations are color coded using a standard heat colormap (red is for saturated roads, grey for unused ones). The width of the road is also proportional to its occupation.
-
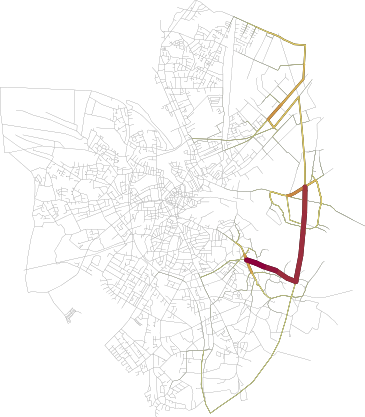
A first cluster of trajectories
The display uses a similar colormap but with local weighting, that is red corresponds here to the most used roads by the trajectories of this cluster.
-
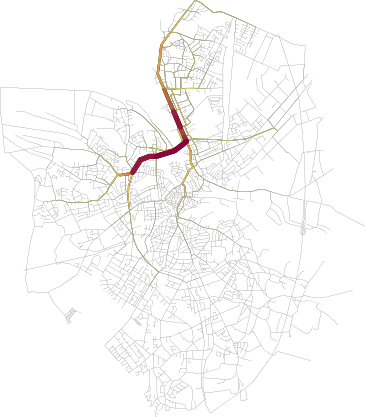
Another cluster of trajectories
-
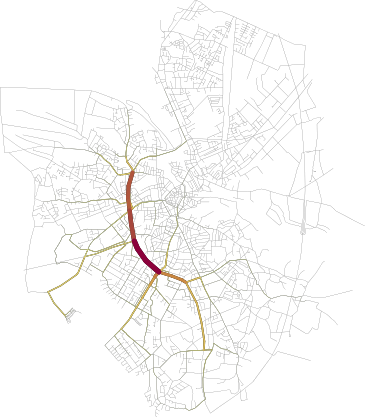
Yet another cluster of trajectories
Functional data
I've been working on functional data since quite a long time (2000, roughly). My most recent paper on the subject is with my PhD student Romain Guigourès and his adviser at Orange Labs Marc Boullé. It's an application of Marc's MODL method to unsupervised learning, more precisely to clustering functional data. The method is highly efficient and provides density estimates in a completely parameter less way. A drawback of MODL is its ability to find subtle patterns which are not always easy to interpret. Romain has been working on ways to circumvent this problem and to enable exploratory analysis based on MODL's proved density estimation quality.
We applied this simplification techniques to the electric power consumption data set available here and obtained the following results, among others.
-
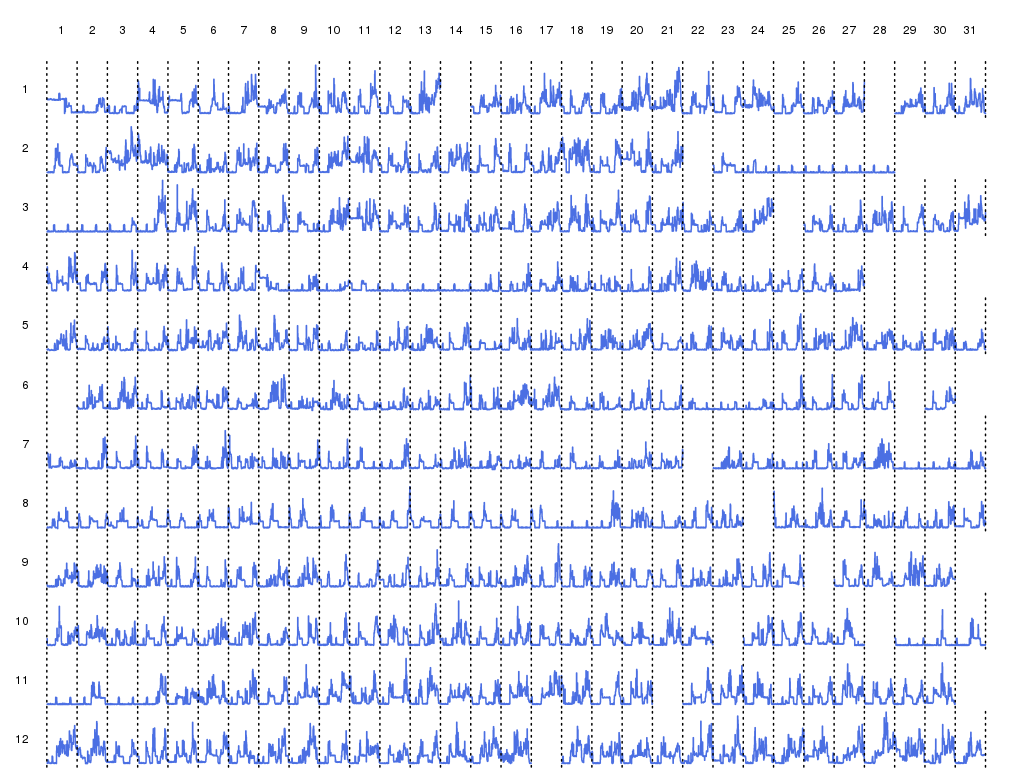
A complete representation of the power consumption data set over the year. Each line is a month, each column a day in the month.
-

Four clusters of dates according to MODL. The clusters are mostly dominated by average consumption effects, but with some subtlety. For instance, the purple clusters gather days with rather high average power consumption but with a distinctive aspect (compared to the blue cluster): the corresponding days have a high power consumption at night (from midnight to six am), a rare fact in the data set (see May the 6th for a concrete example).
Temporal Graphs
We have also applied MODL to graph clustering. We consider in particular the case of temporal graphs: we have a fixed set of actors (the vertices of the graph) that interact at certain times. Each (directed) interaction is timestamped (we allow as many interactions as needed between two given actors, that is we work with directed multi-graphs). Using MODL, we build a block model for temporal graphs which clusters actors as sources of interaction and actors as receivers of interaction, and segments simultaneously the time line into intervals. This work has been presented at the Co-Clustering workshop of IEEE ICDM 2012 in December 2012 English and in October 2012 at the Marami conference in French.
Historical data analysis
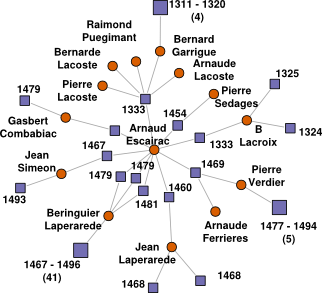
I've been working since 2008 on the analysis of a large historical data set extracted from notarial contracts from 1200 to 1500 in a small Seigneurie from the south of France. This data set is so unique that my initial work on the subject was even mentioned in Nature News! In 2012, I kept working on those data in two directions:
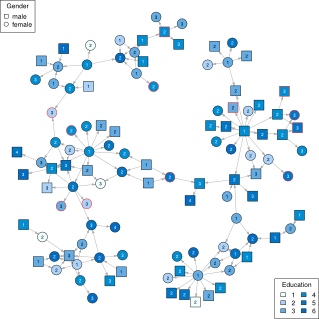
- I showed how graph analysis tools can be applied to an information model extracted from the relational database representation of the data in order to asses the consistency of the data set.
- I studied the influence of geographical proximity (as extracted from the data set) on the interaction network.
Extended versions of those abstracts will be published in 2013 (the geographical analysis is already available).
Information visualization
I've not published anything in information visualization this year (even if the work with Romain includes nice and rather original visual representations of our results), but I've co-organized in February the Dagstuhl seminar on Information Visualization, Visual Data Mining and Machine Learning. This was a unique event which gathers specialists of information visualization and of machine learning in the perfect Dagstuhl environment. A summary of our work is available as a Dagstuhl report and the seminar was presented in Informatik-Spektrum.
Other works
I've also published in 2012 a chapter on information propagation in social networks. This is a quite unique work in the sense that it is based on polls and interviews conducted in France with a longitudinal study on a very large set of 4500 persons. Those data enabled us to design a local propagation model that was then implemented on random graphs to study its global properties.
Finally, I had the opportunity to participate to a survey article on neural networks for complex data in which I described, among others, my work on functional data and on dissimilarity data.
2012 publication list
- A Triclustering Approach for Time Evolving Graphs (conference) In Co-clustering and Applications, IEEE 12th International Conference on Data Mining Workshops (ICDMW 2012), pages 115-122, Brussels, Belgium, December 2012.
- Neural Networks for Complex Data (article) KI - Künstliche Intelligenz, volume 26, pages 373-380, November 2012.
- Triclustering pour la détection de structures temporelles dans les graphes (conference) In 3ème conférence sur les modèles et l'analyse des réseaux : Approches mathématiques et informatiques (MARAMI 2012), Villetaneuse, France, October 2012.
- Dissemination of Health Information within Social Networks (chapter) In Networks in Social Policy Problems, edited by Balázs Vedres and Marco Scotti, pages 15-46, October 2012.
- Graph-Based Approaches to Clustering Network-Constrained Trajectory Data (conference) In Proceedings of the Workshop on New Frontiers in Mining Complex Patterns (NFMCP 2012), edited by Annalisa Appice, Michelangelo Ceci, Corrado Loglisci, Giuseppe Manco, Elio Masciari and Zbigniew Ras, pages 184-195, Bristol, Royaume-Uni, September 2012.
- Dagstuhl Manifesto: Information Visualization, Visual Data Mining and Machine Learning (Dagstuhl Seminar 12081) (editorial) Informatik-Spektrum, volume 35, pages 58-83, August 2012.
- Proceedings of the Dagstuhl Seminar 12081: Information Visualization, Visual Data Mining and Machine Learning (proceedings) Proceedings edited by Daniel A. Keim, Fabrice Rossi, Thomas Seidl, Michel Verleysen and Stefan Wrobel. Dagstuhl Reports, volume 2, number 2, pages 58-83, Dagstuhl, Germany, June 2012.
- Exploration relationnelle d'un corpus d'actes notariés médiévaux (conference) In Colloque 'configuration(s)', Nanterre, France, June 2012.
- Spatial correlation in bipartite networks: the impact of the geographical distances on the relations in a corpus of medieval transactions (conference) In Modèles et Apprentissage en Sciences Humaines et Sociales (MASHS 2012), Paris, France, June 2012.
- Clustering par optimisation de la modularité pour trajectoires d'objets mobiles (conference) In Actes des 8èmes journées francophones Mobilité et Ubiquité, edited by Nadine Roose, pages 12-22, Anglet, France, June 2012.
- Modularity-Based Clustering for Network-Constrained Trajectories (conference) In Proceedings of the XXth European Symposium on Artificial Neural Networks, Computational Intelligence and Machine Learning (ESANN 2012), pages 471-476, Bruges, Belgique, April 2012.
- A Discussion on Parallelization Schemes for Stochastic Vector Quantization Algorithms (conference) In Proceedings of the XXth European Symposium on Artificial Neural Networks, Computational Intelligence and Machine Learning (ESANN 2012), pages 477-482, Bruges, Belgique, April 2012.
- Dissimilarity Clustering by Hierarchical Multi-Level Refinement (conference) In Proceedings of the XXth European Symposium on Artificial Neural Networks, Computational Intelligence and Machine Learning (ESANN 2012), pages 483-488, Bruges, Belgique, April 2012.
- Clustering hiérarchique non paramétrique de données fonctionnelles (conference) In Actes de la 12ème Conférence Internationale Francophone sur l'Extraction et la Gestion des Connaissances (EGC'2012), pages 101-112, Bordeaux, France, February 2012.
Published
27 October 2012
Tags
